
Figure 1.
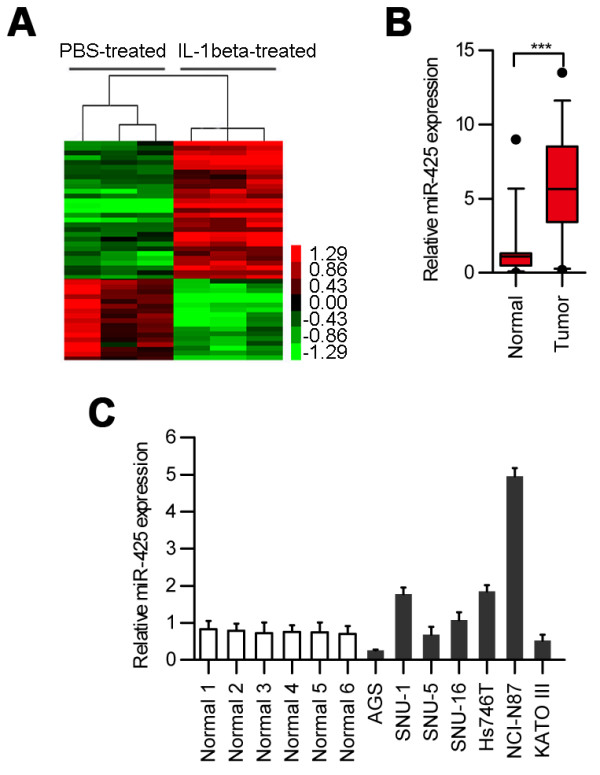
Dysregulation of miRNAs in human AGS cells treated with IL-1β. (A) Human AGS cells were treated with IL-1β (10 ng/ml) [14], and 24 h later, the miRNAs expression profile was analysed with microarray technology. Heat map diagram generated by unsupervised clustering analysis with 46 significantly dysregulated miRNAs. Red indicates upregulation; green indicates downregulation. (B) Increased levels of miR-425 in 36 tumor samples relative to their levels in matched adjacent normal tissues as measured by real-time PCR. Normal: adjacent normal tissues. (C) Expression level of miR-425 was examined by real-time PCR in multiple gastric cancer cell lines and six normal gastric mucosa cells.