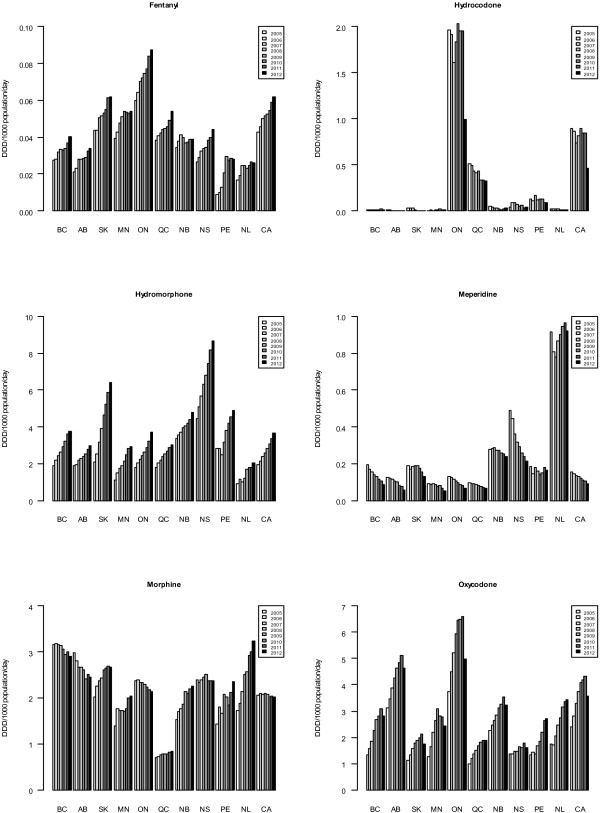
Figure 2.
Annual dispensing of select strong opioids in Canada, 2005–2012. Annual dispensing of select strong opioids, in DDD per 1000 population/day, by province and Canada total, 2005–2012. Bars are chronological for years 2005–2012. For names of provinces, see Table 1. CA represents Canada (total).

