Figure 1.

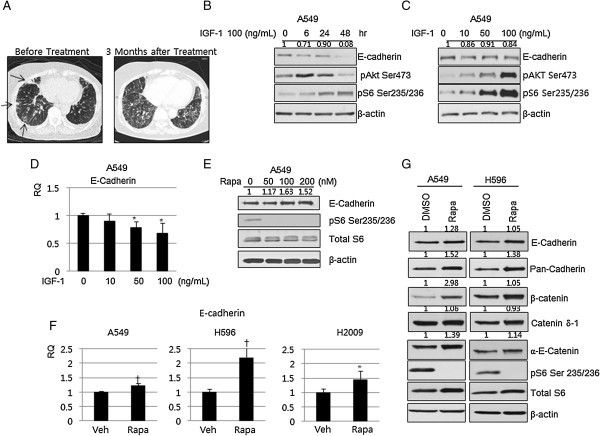
Involvement of the mTOR pathway in the expression of E-cadherin and components of the adherens junctional complex. (A) Representative chest computed tomographic imaging of 67-years old female patient, who had taken rapalog for 3 months under the diagnosis of metastatic recurred breast cancer. Compared with imaging prior to the rapalog treatment (left), size of multiple metastatic nodules (arrows) were decreased but ground glass opacity with interstitial thickenings were newly developed throughout the lung fields (right). (B) A549 cells were treated with 100 ng/mL IGF-1 for the indicated time, and expression of E-cadherin was evaluated by immunoblotting. A549 cells were treated with the indicated dose of IGF-1 for 16 hr and expression of E-cadherin was evaluated by immunoblotting (C) and qRT-PCR (D). (E) A549 cells were treated with the indicated dose of rapamycin for 16 hr and expression of E-cadherin was evaluated by immunoblotting. (F) A549, H596, and H2009 NSCLC cells were treated with 100 nM rapamycin for 16 hr and E-cadherin mRNA was evaluated by qRT-PCR. (G) A549 and H596 NSCLC cells were treated with 100 nM of rapamycin for 16 hr and expression of the components of the adherens junction complex were evaluated by immunoblotting. Data was analyzed by one-way ANOVA followed by Tukey’s multiple comparison test (D) or an independent sample t-test (F). β-actin was used as a loading control. RQ: relative quantitation, Rapa: rapamycin, veh: vehicle. Error Bars, SD of 3 independent experiments; *, P < 0.05; †, P < 0.01.
