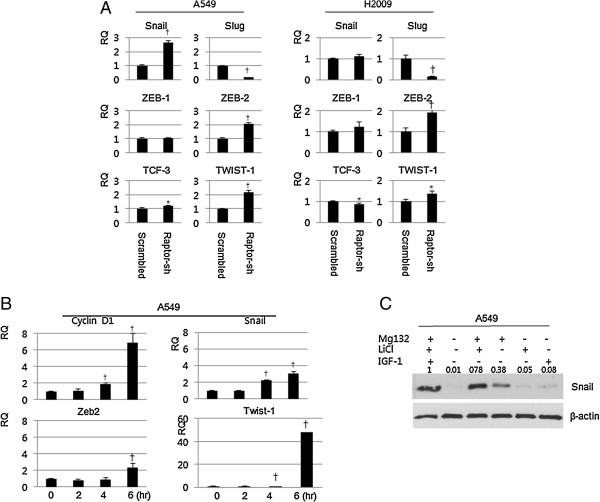
Figure 4.

E-cadherin repressor complexes are elevated in Raptor-silenced cells. (A) A549 and H2009 cells were transduced with scrambled or Raptor shRNA and E-cadherin repressor complex mRNAs were evaluated by qRT-PCR. Data were analyzed by the t-test. (B) A549 cells were treated with 40 mM LiCl for the indicated times and E-cadherin repressor complex mRNAs were evaluated by qRT-PCR. Data were analyzed by one-way ANOVA followed by Tukey’s multiple comparison test. (C) A549 cells were treated with MG132 (10 μM) and LiCl (40 mM), and/or IGF (10 ng/mL) for 6 hr and expression of Snail was evaluated by immunoblotting. β-actin was used as a loading control. Error Bars, SD of 3 independent experiments; RQ, relative quantitation; *, P < 0.05; †, P < 0.01.
