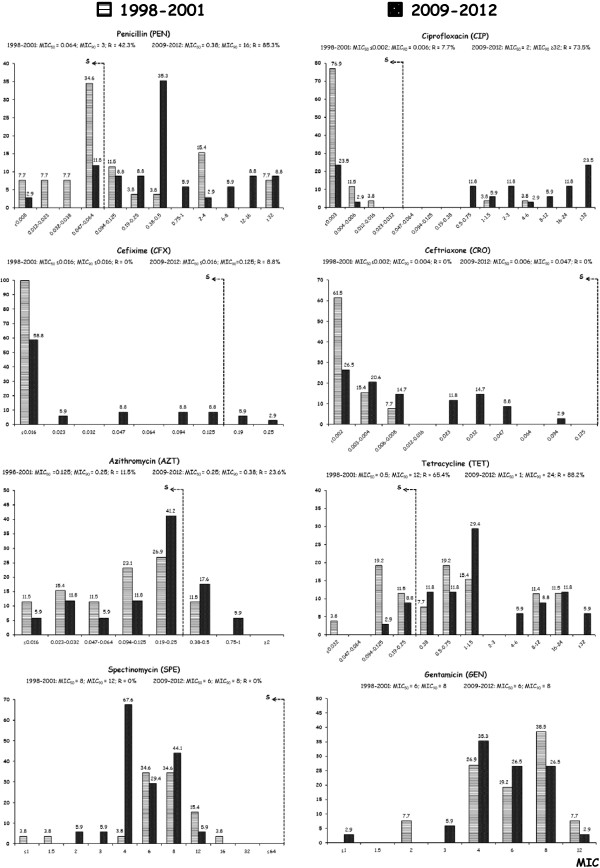
Figure 1.
MIC values distribution for the eight antibiotics tested against theNg isolates detected during the two different periods (1998–2001versus2009–2012). “S”, indicates the cut-off of susceptibility, whereas “R” indicates the isolates intermediate or resistant according to the EUCAST criteria [26]. The results clearly show that the MICs for cephalosporins increased over time (i.e., CRO: from MIC90 of 0.004 mg/L to 0.047 mg/L; CFX: from MIC90 ≤ 0.016 to 0.125 mg/L with also 8.8% of the isolates resistant) and that the prevalence of PEN-, CIP-, and TET-resistant isolates reached dramatic levels.

