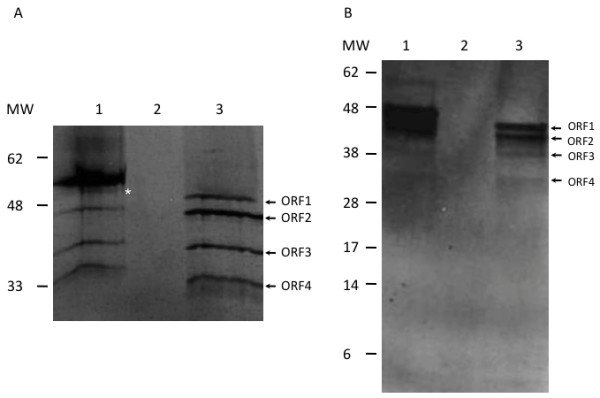
Figure 2.

In vitro transcription/translation of protein from the PTI-1 gene. Protein products are visualized by gel electrophoresis followed by autoradiography. A. Analysis on a 12% polyacrylamide gel. B. Analysis on a precast 12% BIS TRIS gel run in MES buffer. Lanes 1: positive control encoding Xenopus eEF1A; Lanes 2: negative control without DNA template; Lanes 3: transcription/translation from the pZeoSV2-PTI-1-FL construct. Arrows indicate the bands with potential correspondance to protein products resulting upon translation of ORFs 1, 2, 3 and 4 shown in Figure 1. The weak band in lane 1 marked by an asterisk may correspond to the product resulting upon translation from the second in-frame AUG of the Xenopus eEF1A template.
