
Figure 4.
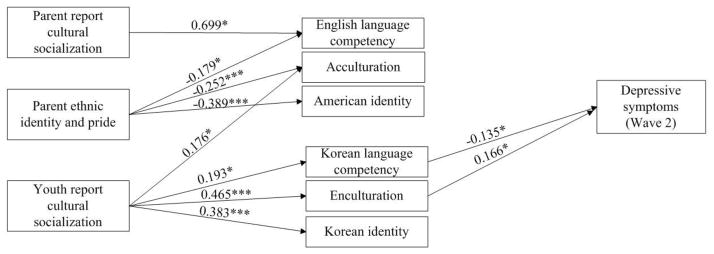
Final longitudinal path model (Wave 2 outcomes, controlling for Wave 1 outcomes)
Fit indices: χ2(35) = 78.320, p = 0.001, CFI = 0.904, RMSEA = 0.065
Path coefficients are standardized, *p < .05; ** p< .01; ***p < .001
Several paths are not shown for simplicity, e.g. four controls for the outcome variable (age, gender, family SES, and prior level depressive symptoms) and covariations, respectively, among three independent variables on the far left hand side, three ethnic orientation variables and three mainstream orientation variables. Also not shown are three additional paths between ethnic orientation and mainstream orientation variables, suggested by Modification Index (MI).