
Figure 4. Histomorphologic changes in kidney (tissues are stained with hematoxylin and eosin).
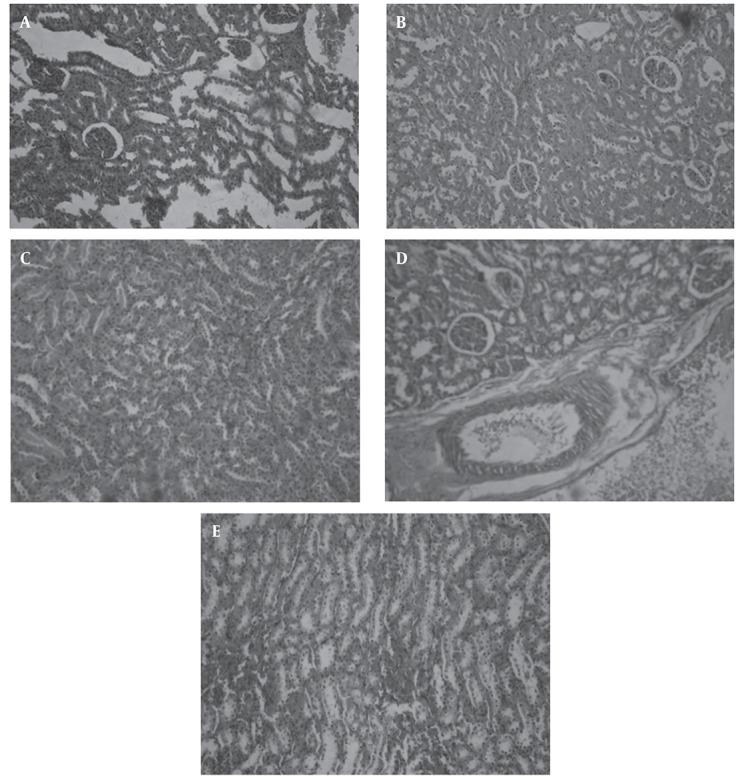
A: Photomicrograph of renal from healthy animals receiving vehicle (X = 100). B: Photomicrograph of renal from diabetic animals receiving vehicle (X = 100). C: Photomicrograph of renal from diabetic rats treated by of 200 mg/kg BS extract dosage (X = 100) D: Photomicrograph of renal of diabetic animals treated by 400 mg/kg BS extract dosage (X = 100) E: Photomicrograph of renal of diabetic animals treated by 600 mg/kg BS extract dosage (X = 100)