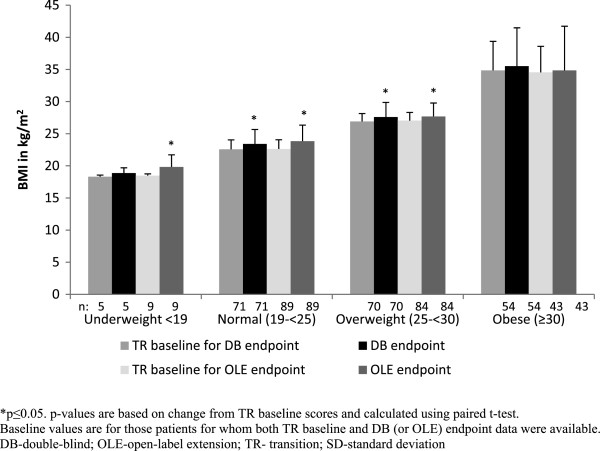
Figure 5.
Mean (SD) BMI at TR baseline, DB endpoint and OLE endpoint (ITT analysis set). *p ≤ 0.05; p values are based on change from TR baseline scores and calculated using paired t-test. Baseline values are for those patients for whom both TR baseline and DB (or OLE) endpoint data were available. DB- double-blind; OLE- open-label extension; TR- transition; SD- standard deviation.

