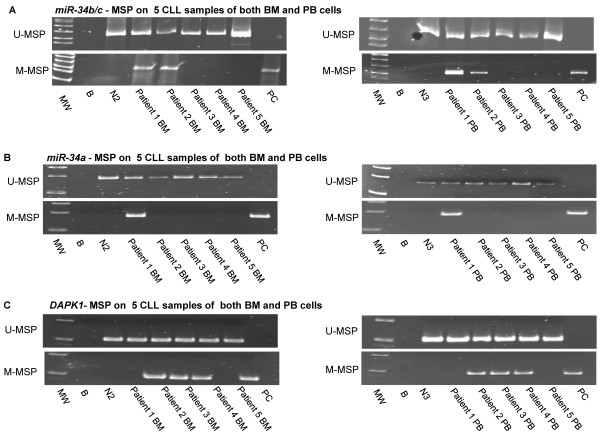
Figure 4.
Comparison of the MSP results of miR-34b/c, miR-34a and DAPK1 between the bone marrow cells and peripheral blood cells of the same CLL patients. U-/M-MSP analysis of (A)miR-34b/c, (B)miR-34a and (C)DAPK1 on 5 CLL primary samples of both bone marrow and peripheral blood cells. MW: Marker; B: Reagent blank; N2: Normal bone marrow control; N3: Normal peripheral blood control; Patient BM: Bone marrow cells of CLL sample at diagnosis; Patient PB: Peripheral blood cells of CLL sample at diagnosis; PC: Positive control with methylated DNA.

