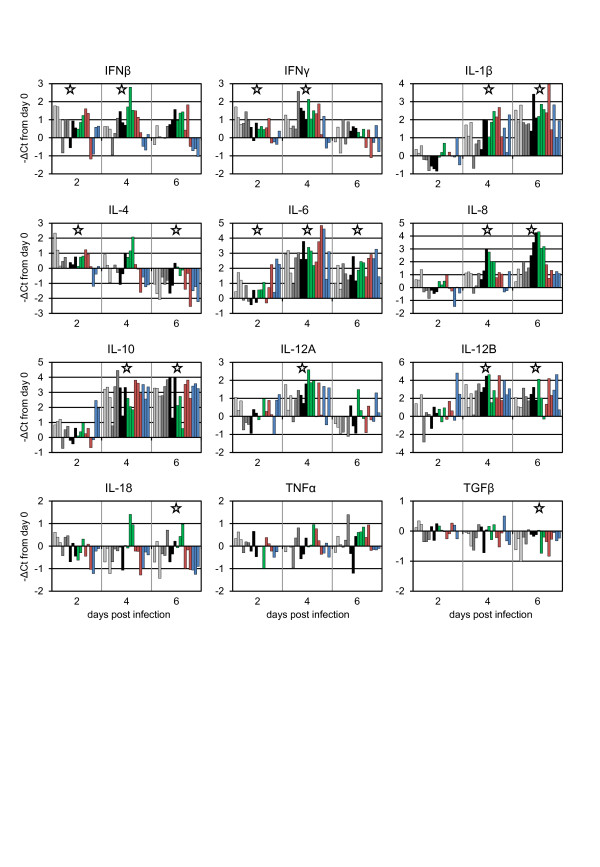
Figure 6.
Changes in cytokine mRNA transcription in goats infected with PPRV. Animals were infected with different PPRV isolates as described in Figure 1. The changes in transcription of mRNA for various cytokines was determined for each experimental animal over the first six days of the study and are plotted as –ΔCt from day zero, so that an increase in mRNA appears as an increase in the value plotted. Stars indicate days on which the transcription of that cytokine was significantly different from day zero. Bars are colour-coded as in Figures 1–5 to indicate the different PPRV isolates used.

