
Figure 6.
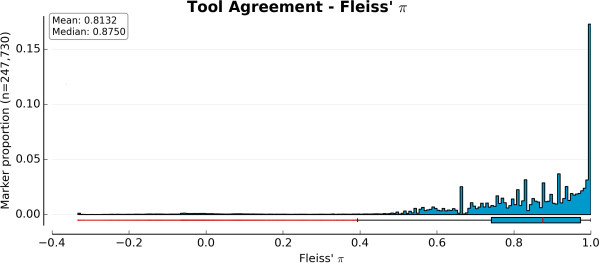
Tool agreement. Distribution of Fleiss’ π coefficient for all 247,730 markers when the following four tools are compared: GenCall (optimized cluster file), GenoSNP (optimized), optiCall (without excluding markers failing Hardy-Weinberg) and zCall. Values closer to 1 indicate good agreement. Using the interquartile range, there were a total of 12,122 outliers (represented as red dots in the boxplot).