
Figure 1.
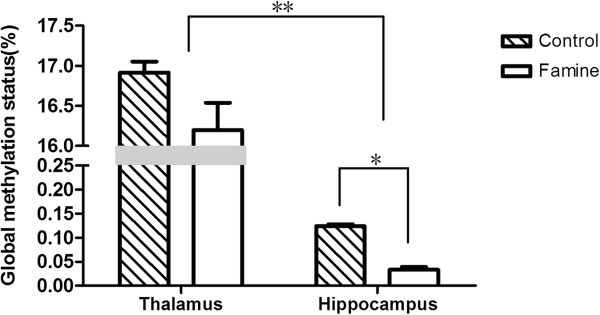
The global DNA methylation levels in the thalamus and hippocampus of postnatal malnourished mice and normal mice. Data are the mean ± s.e.m. *P = 0.046 (control group and famine group in the hippocampus, Student’s t-test). **P = 6.413e-05 (control group in the thalamus and hippocampus, Student’s t-test); 4.394e-04 (famine group in the thalamus and hippocampus, Student’s t-test).