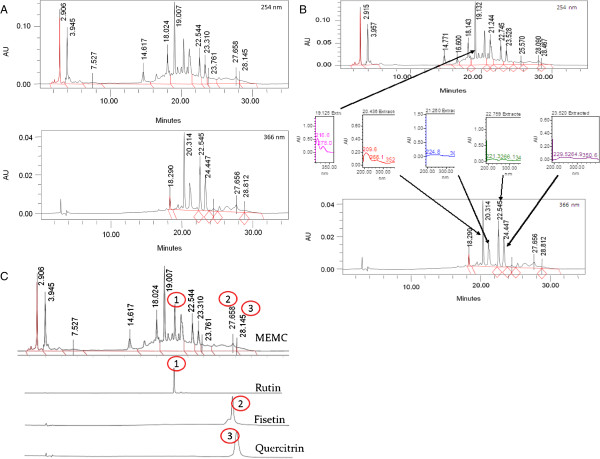
Figure 1.
The HPLC profile of MEMC. (A). The HPLC chromatograms of MEMC at the wavelengths of 254 and 366 nm.; B). The UV spectra analysis of MEMC demonstrated the presence of five major peak, namely peak 1 (RT = 19.125 min), peak 2 (RT = 20.436 min), peak 3 (RT = 21.26 min), peak 4 (RT = 22.756 min) and peak 5 (RT = 23.52 min), which were observed at their respective λmax at the respective region of 216.6-278, 209.6-352.9, 224.8-364.2, 221.3-347 and 229.5-350.6 nm, suggesting, in part, the presence of flavonoid-based compounds.; and; C) Chromatogram of MEMC at 254 nm showing the presence of flavonoids type compounds, namely rutin, quercitrin, and fisetin, based on the comparison of their respective UV spectra analysis.

