Figure 3.

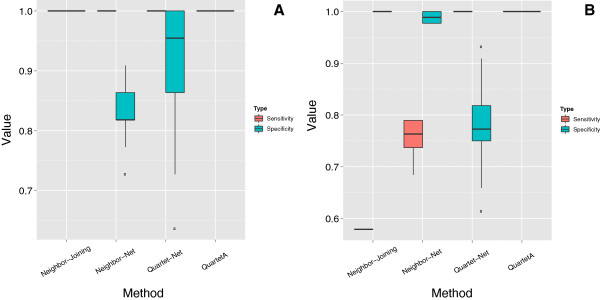
Comparison of four phylogenetic reconstruction methods in tree (A) and network (B) reconstruction. The red bar indicates sensitivity and the other one indicates specificity; the horizontal line indicates the median performances.

Comparison of four phylogenetic reconstruction methods in tree (A) and network (B) reconstruction. The red bar indicates sensitivity and the other one indicates specificity; the horizontal line indicates the median performances.