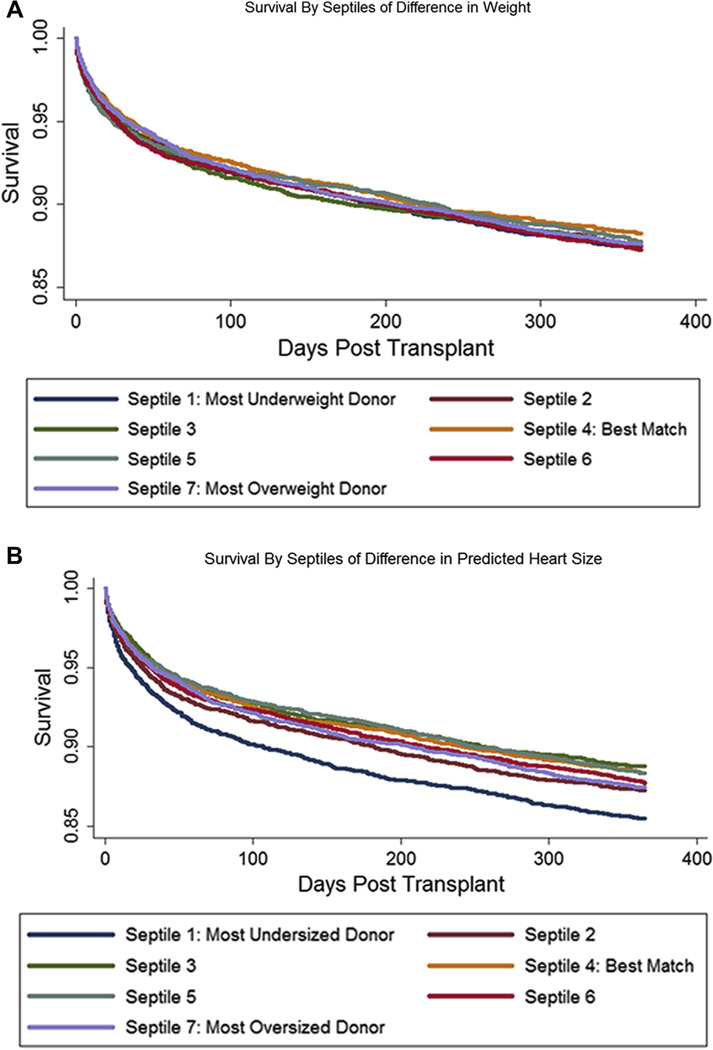
Figure 3. Unadjusted Kaplan-Meier Graphs of Survival, by Septiles of Matching by Body Weight Versus pHM.
(A) Survival by body weight. Compared with best-matched quantile, no significant differences were found (hazard ratio [HR], most-underweight quantile: 1.07; 95% CI: 0.95 to 1.21; p = 0.25). (B) Survival by predicted heart mass (pHM). Compared with best-matched quantile, most-undersized had reduced survival (HR: 1.27; 95% CI: 1.12 to 1.43; p < 0.001). Abbreviations as in Figure 1.

