
Figure 7.
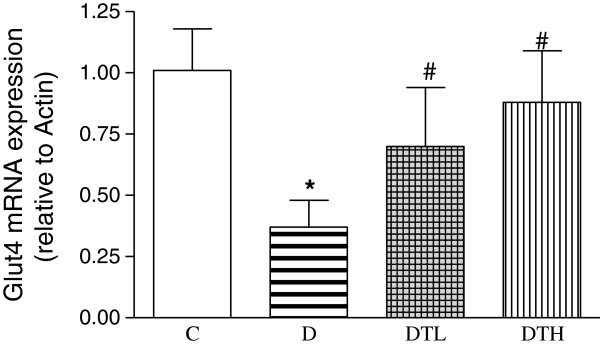
Real-time fluorescence quantitative polymerase chain reaction (PCR) analysis of myocardial mRNA expression of glucose transporter type 4 (Glut4) in control, diabetic and diabetic treated with low (2 μg · kg−1.d−1) or high (10 μg · kg−1.d−1) dose of exenatide. Relative gene expression levels were normalized relative to β-actin. Control (C, n = 7), diabetic (D, n = 10), diabetic treated with low dose (2 μg · kg−1.d−1) of exenatide (DTL, n = 10), diabetic treated with high dose (10 μg · kg−1.d−1) of exenatide (DTH, n = 9). Data are expressed as mean ± S.E.M. *P < 0.05 different from control, #P < 0.05 different from diabetic.