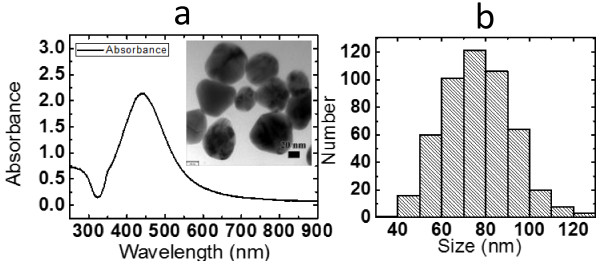
Figure 2.

Absorption spectra and particle size distribution of nanoparticles. (a) Absorption spectra of silver nanoparticles. The inset shows the image of silver nanoparticles obtained by transmission electron microscopy; the scale of the image is 20 nm. (b) The particle size distribution of 500 nanoparticles.
