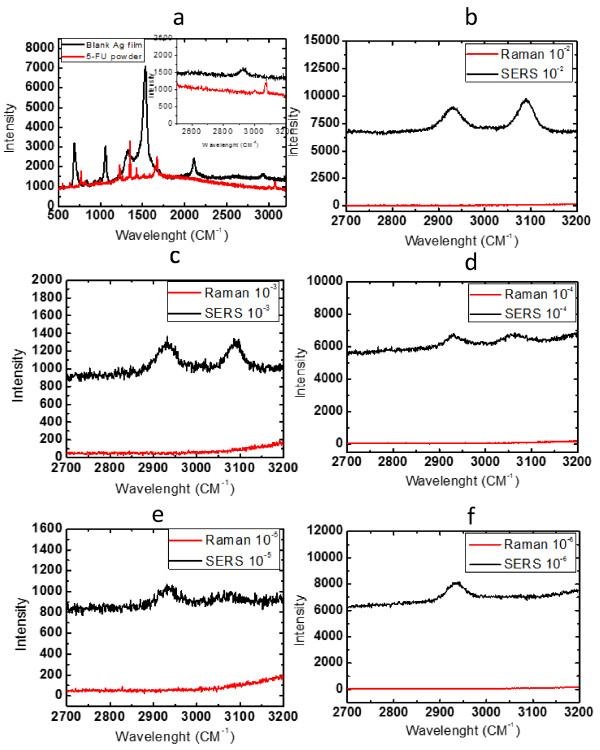
Figure 7.
Raman spectroscopy and surface-enhanced Raman spectroscopy. 5-Fluorouracil solution and blank Ag film (a) (the inset shows the detail near 3,100 cm−1 with enlarged scale) and different concentrations (b) 1 × 10⁻², (c) 1 × 10⁻³, (d) 1 × 10⁻⁴, (e) 1 × 10⁻⁵, and (f) 1 × 10⁻⁶. In (b to f), the solid curve is the Raman spectroscopy of 5-fluorouracil solution on silver nanoparticle film, and the dash curve is the Raman spectroscopy of 5-fluorouracil solution on silica substrate.

