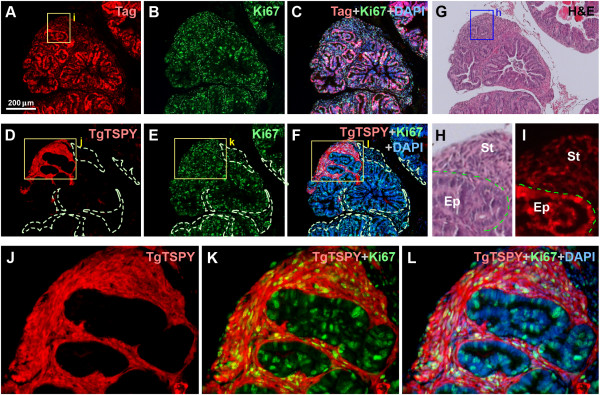
Figure 1.
Expression of TSPY transgene in the prostates of TgTSPY9/LADY mice at 12 weeks of age. A-C, Double immunofluorescence staining of T-antigen (red) and Ki67 (green) in the prostate of TgTSPY9/LADY mouse at 12 weeks of age. DNA was visualized by DAPI staining (blue). C represents the merged image of T-antigen (red), Ki67 (green) and DNA (blue). D-F, Double immunofluorescence staining of the TSPY-transgene product (TgTSPY, red) and Ki67 (green) on the adjacent section of A-C. F represents the merged image of TgTSPY (red), Ki67 (green) and DNA (blue). TgTSPY-negative hypercellular stroma areas were circled by dot lines. G-H, H&E staining of an adjacent section of A-C. H shows the highly magnified image of the boxed area in G. Epithelial cells (Ep) and hypercellular stroma (St) were labeled. I is a highly magnified view of the boxed area in A, staining of T-antigen. T-antigen was expressed in both epithelial cells and stromal cells. J-L, Highly magnified views of TgTSPY (red) and Ki67 (green) for the boxed area in D-F respectively. K represents the merged view of TgTSPY (red) and Ki67 (green), and L represents the merged image of K plus DNA staining (blue). Scale bar = 200 μm in A-G. Significant expression of TgTSPY was frequently detected in hypercellular stroma, developed in the prostate of TgTSPY9/LADY mice at this age.

