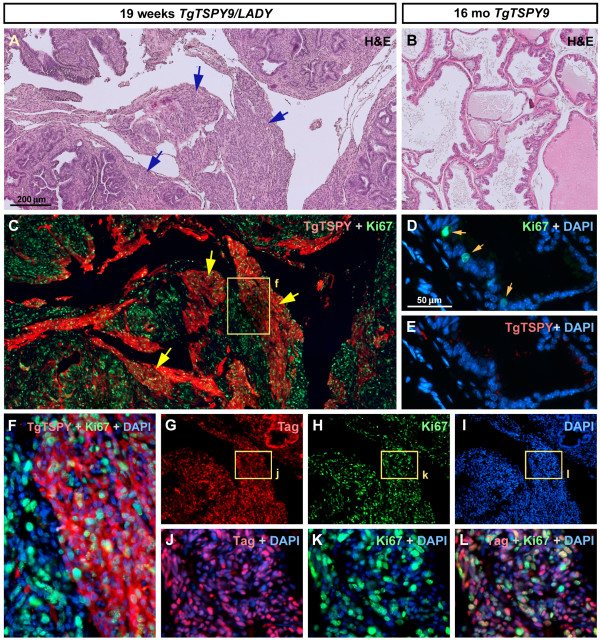
Figure 2.
Expression of TSPY-transgene in the prostates of TgTSPY9/LADY mice at 19 weeks of age. A, Representative H&E staining image of the sections of prostate from TgTSPY9/LADY mouse at age 19 weeks. Hypercellular stroma was further enlarged comparing with 12 weeks of age (arrows). B, H&E stained image of the sections of prostate from TgTSPY9 mouse at 16 months of age. C, Double immunofluorescence staining of the TSPY-transgene product (TgTSPY, red) and Ki67 (green) in the adjacent section of A. TgTSPY was significantly expressed in large part of hypercellular stroma. D-E, Double immunofluorescence staining of TgTSPY (red) and Ki67 (green) in the prostate from TgTSPY9 mouse at 16 month of age. D represents a merged image of Ki67 (green) and DNA (blue), and E represents a merged image of TgTSPY (red) and DNA (blue). F represents a highly magnified view of the boxed area in C, showing signals of TgTSPY (red), Ki67 (green) and DNA (blue). G-I, Double immunofluorescence staining of T-antigen (Tag) and Ki67 in the prostate from TgTSPY9/LADY mouse at age 19 weeks (adjacent section of C). DNA was visualized by DAPI staining (blue). J-L, Highly magnified views of boxed areas in G-I. J and K represents the merged images of Tag (red) and DNA (blue), or Ki67 (green) and DNA (blue), respectively. L represents the merged view of Tag (red), Ki67 (green) and DNA (blue). Scale bar = 200 μm in A-C, G-I, and 50 μm in D-E. Tag and Ki67 expressed closely in same cells of the prostate of TgTSPY9/LADY mouse at age 19 weeks.

