Figure 4.

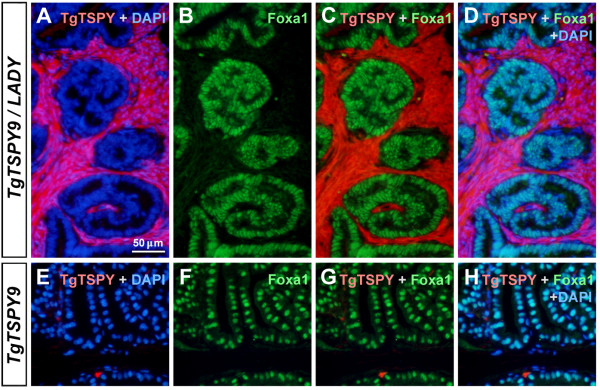
Expression of TSPY-transgene and Foxa1 in the prostates of TgTSPY9/LADY mice at 14 weeks of age. A-D, Double immunofluorescence staining of the TSPY-transgene product (TgTSPY, red) and Foxa1 (green) in the prostate of TgTSPY9/LADY mouse at 14 weeks of age. DNA was visualized by DAPI staining (blue). C represents the merged view of TgTSPY (red) and Foxa1 (green), and D represents the merged view including DNA (blue). Note that the expression of TgTSPY did not overlap with that of Foxa1. E-H, Double immunofluorescence staining of TgTSPY (red) and Foxa1 (green) in the prostate of singly transgenic TgTSPY9 mouse at 14 weeks of age. G represents the merged view of TgTSPY (red) and Foxa1 (green), and H represents the merged view including DNA (blue). Scale bar = 50 μm in A-H.
