FIGURE 1.

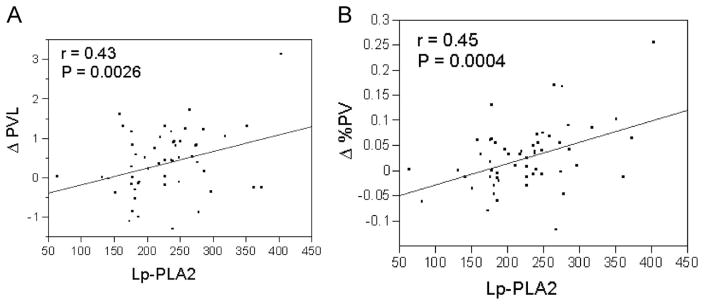
(A) X–Y scatterplot for the correlation between Lp-PLA2 and changes in plaque volume (r=0.43; P=0.0026). (B) X–Y scatterplot for the correlation between Lp-PLA2 and changes in percent plaque volume (r=0.45; P=0.0004).

(A) X–Y scatterplot for the correlation between Lp-PLA2 and changes in plaque volume (r=0.43; P=0.0026). (B) X–Y scatterplot for the correlation between Lp-PLA2 and changes in percent plaque volume (r=0.45; P=0.0004).