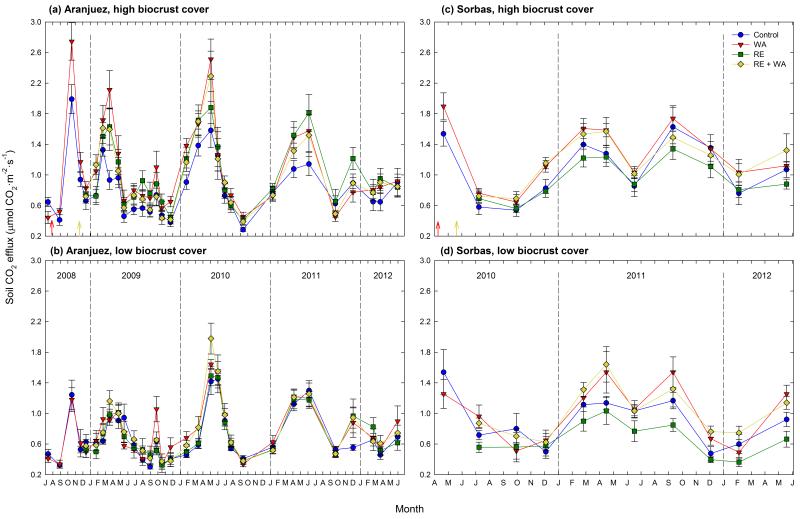
Figure 2. Temporal variation of soil CO2 efflux in the Aranjuez (a, b) and Sorbas (c, d) experimental sites.
Red and light yellow arrows indicate the dates when the warming (WA) and rainfall exclusion (RE) treatments were installed, respectively. Data are means ± SE (n = 10 and 8 for Aranjuez and Sorbas, respectively).

