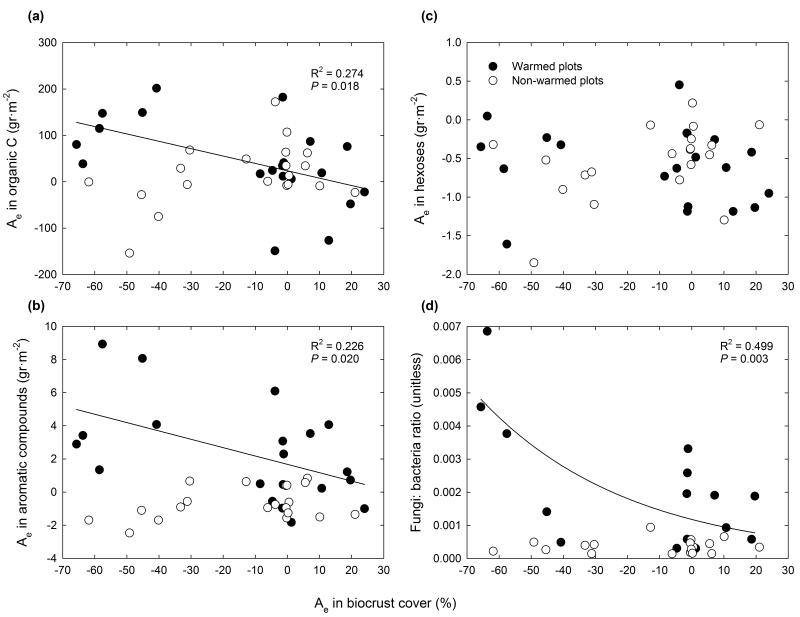
Figure 5. Relationships between the absolute changes (Ae) in biocrust cover and those in organic C (a), aromatic compounds (b), and hexoses (c) during the first 46 months of the experiment at the Aranjuez experimental site, and between the relationship between the Ae in biocrust cover and the fungal: bacterial ratio at this site (d).
Solid lines are significant regressions fitted to the warmed plots. None of the regressions fitted to the non-warmed plots were significant.

