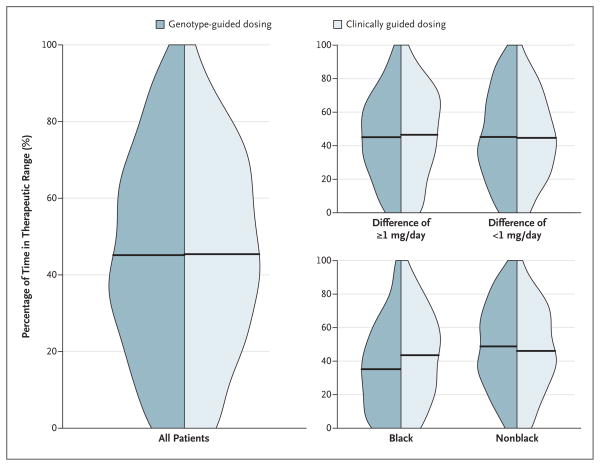
Figure 1. Distribution of Time in the Therapeutic Range.
Side-by-side density plots show the distribution of the percentage of time in the therapeutic range of the international normalized ratio (INR) from the completion of the intervention period (day 4 or 5) to day 28 of therapy for the two study groups among all patients (at left), among patients stratified according to the absolute difference in the predicted initial daily dose of warfarin between the two algorithms (=1 mg [primary subgroup] vs. <1 mg) (at top right), and among patients stratified according to race (at bottom right). The horizontal lines indicate the mean percentage of time in the therapeutic range.

