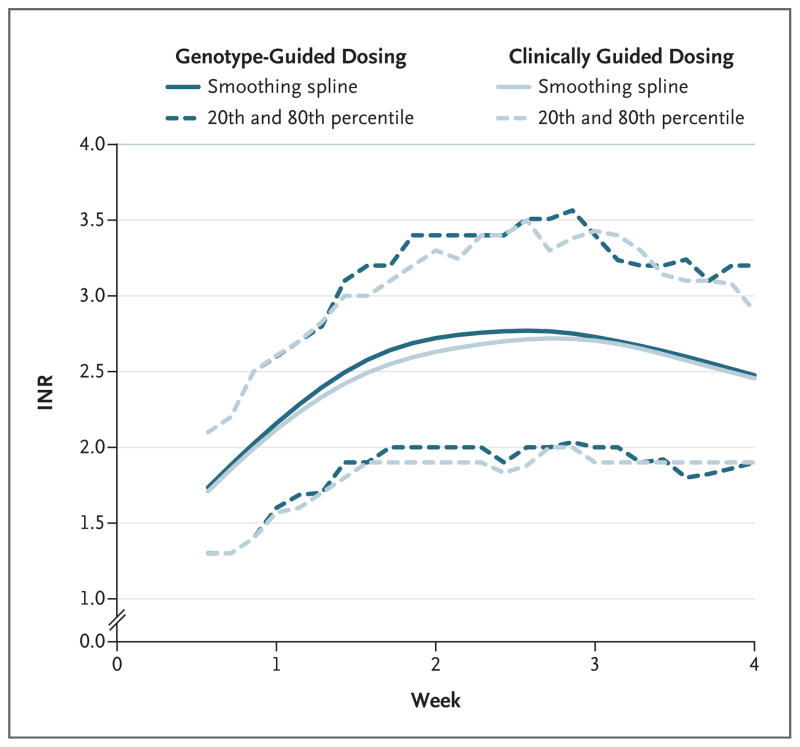
Figure 2. Range of INRs during the 4-Week Study.
Shown are the INRs from the completion of the intervention period (day 4 or 5) to day 28 of therapy in the two study groups. Solid lines represent smoothing splines with 5 degrees of freedom. Dashed lines represent the 20th and 80th percentiles of INR values calculated over a 3-day window.

