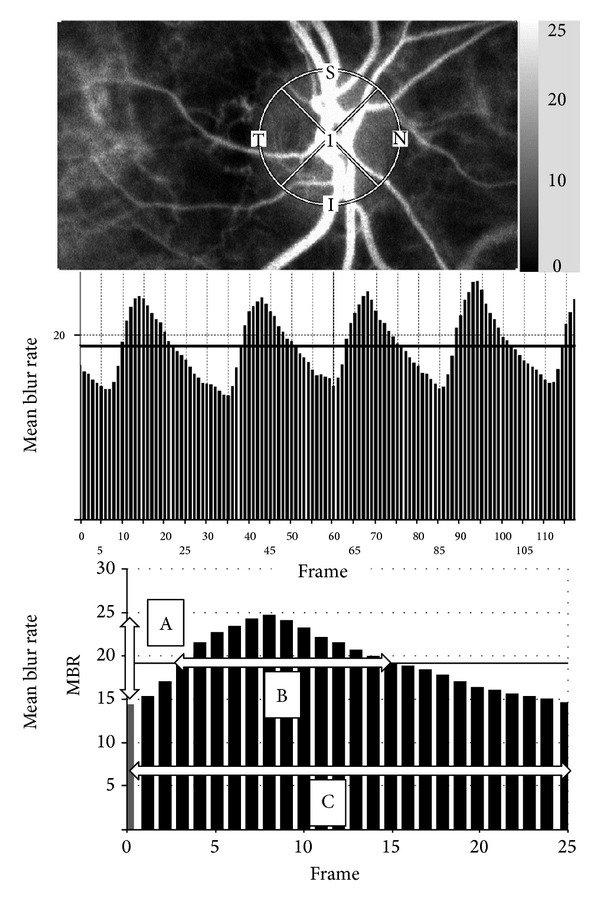
Figure 1.

Method of determining the pulse-wave velocity in the optic nerve head circulation by laser speckle flowgraphy (LSFG). Upper panel: a gray scale photograph of the fundus of the eye. the circle designates the area that was measured in the optic disc area. Middle panel: pulse waves showing changes in the MBR which is tuned to cardiac cycle for 4 seconds. The total number of frames is 118. Lower panel: normalization of one pulse. A = maximum MBR–minimum MBR. B = number of frames spent at one-half the value of A. C = number of frames spent at normalized one pulse.
