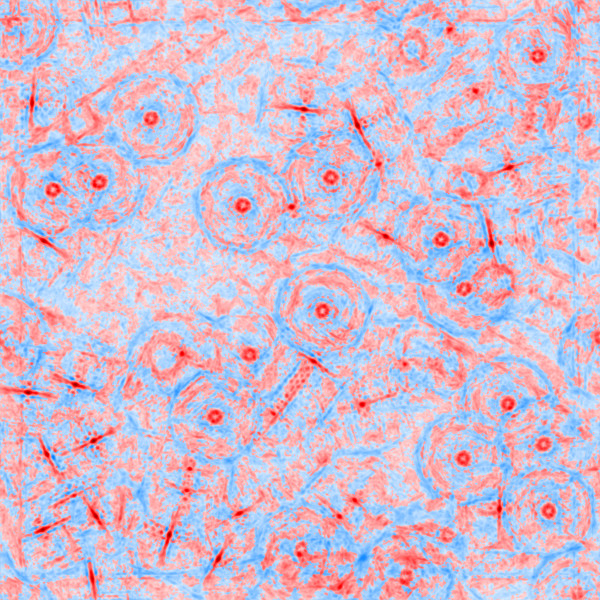
Figure 7.
An example far-from-focus micrograph from the KLH dataset (a), and the calculated global correlation map showing the picked side-view and top-view templates, (b) and (c), which are shown separately for clarity. The higher peaks (negative values in this case) in the correlation maps correspond to the location of particles. Note that while the side-view templates form rings of relatively high correlation around top-view particles in (b), higher correlation at the centres of these rings are obtained when correlating with top-view templates (c).

