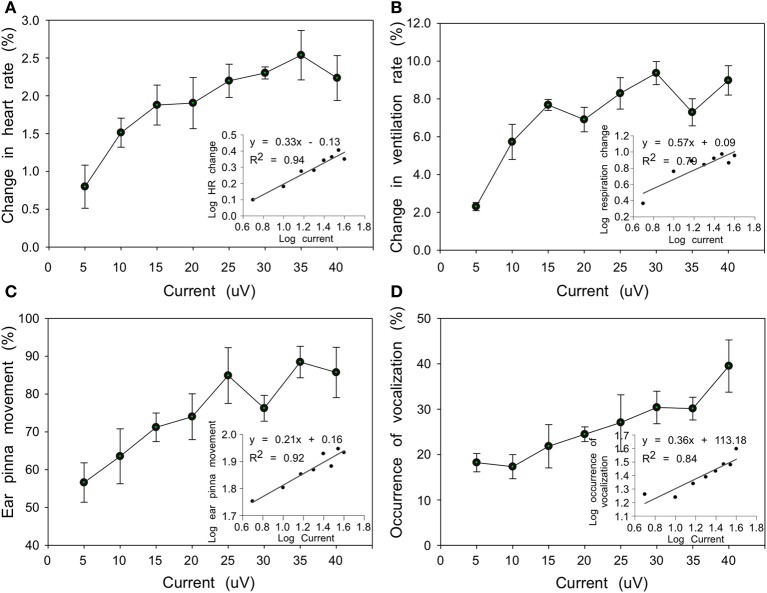
Figure 5.
Line plots showing relationship between current intensity and behavioral responses (A, HR; B, VR; C, PM; D, echolocation vocalizations) averaged from 4 bats. Each dot refers to the averaged behavioral responses (%) relative to the total number of presentations in which a specific current intensity was applied. Insets in each plot show significant linear regression between log10-transformed current intensity and behavioral response.

