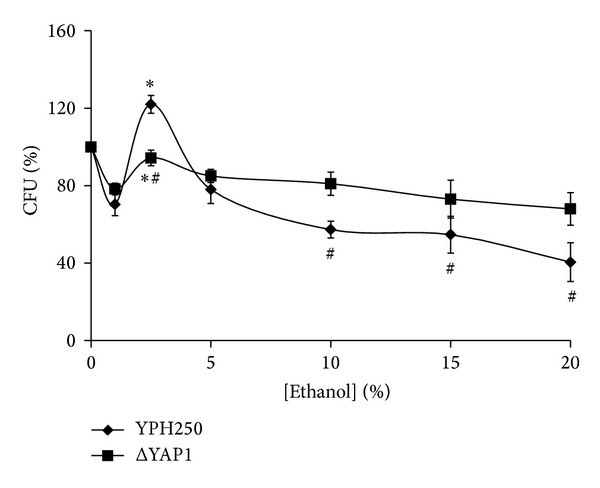
Figure 2.

Colony forming units of S. cerevisiae YPH250 and its derivative ΔYAP1 after exposure to different concentrations of ethanol. Significantly different from respective values obtained for S. cerevisiae YPH250 with P < 0.05#, and for corresponding cells treated with 1% ethanol with P < 0.05*. Data are mean ± SEM (n = 4–6).
