Figure 4.

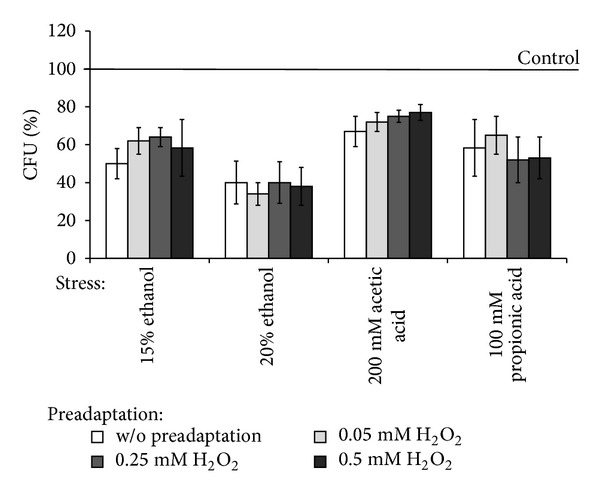
Colony forming units of ΔYAP1 mutant pretreated with low concentrations of H2O2 under exposure to different stresses. Data are mean ± SEM (n = 4–6).

Colony forming units of ΔYAP1 mutant pretreated with low concentrations of H2O2 under exposure to different stresses. Data are mean ± SEM (n = 4–6).