
Figure 4.
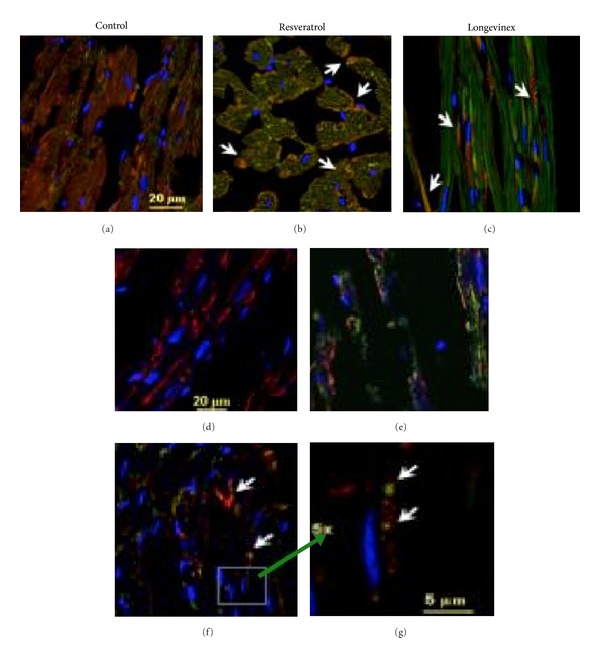
Immunofluorescence multichromatic projections of mitochondrial Sirt3 and TOM20 along with LC3 protein, a marker of autophagosome formation, in the ischaemic (IR) cardiac specimens after treatments with resveratrol or longevinex. Panels (a) and (d) are administration of vehicle only; panels (b) and (e) are administration of resveratrol; panels (c) and (f) are administration of longevinex. Panel (g) is 5x magnification of the selected area indicated in panel (f) where mitochondrial fission and mitophagy are indicated with white arrows. Overlay of the immunofluorescence images of Sirt3 (green), TOM20 (red), and nuclei (blue) is shown in panels (a), (b), and (c); mitochondrial fission is indicated in panels (b) and (c) with white arrows. Overlay of the immunofluorescence images of LC3 (green), TOM20 (red), and nuclei (blue) is shown in panels (d–g); mitochondrial fission is shown in panel (f) with white arrows. The confocal images were taken with optical Z-step of 0.5 µm.