
Figure 2.
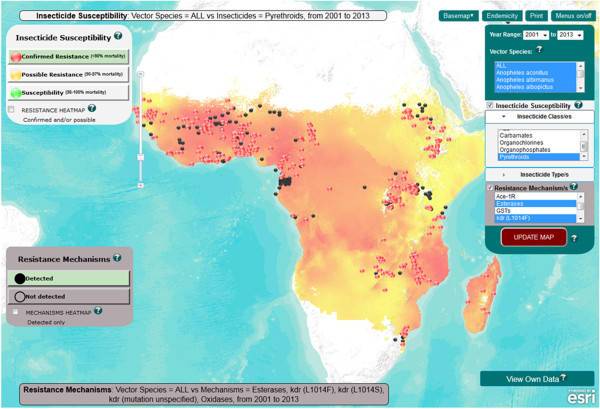
IR Mapper online user interface showing Anopheles spp. pyrethroid resistance (red dots) and detected elevated mono-oxygenase and esterase activity plus kdr mutations (black dots) from 2001 – 2013 (as at 06/12/2013) along with Plasmodium falciparum endemicity estimates for 2010.