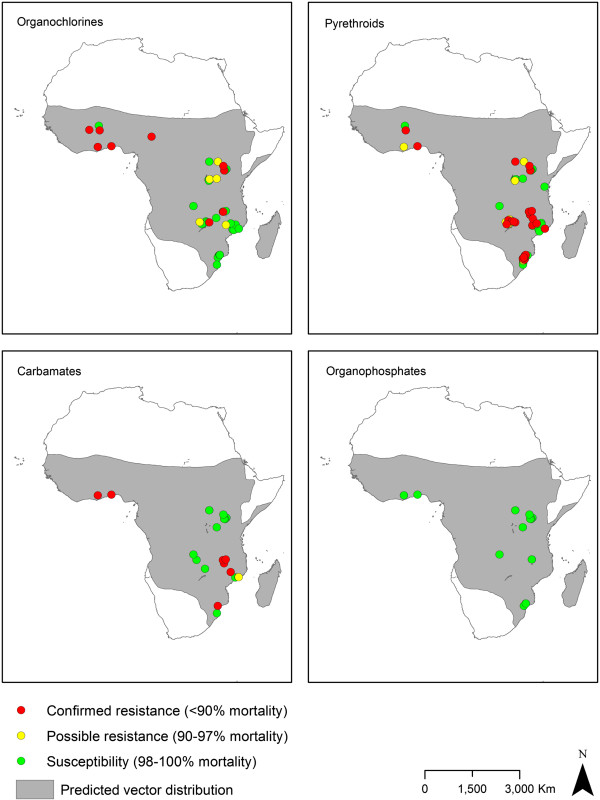
Figure 7.
Distribution of insecticide resistance in An. funestus s.l. collected between 2001 and 2012. Where there were multiple collections, species or insecticides tested, the lowest susceptibility category is displayed. Shading indicates the predicted distribution of the species group [42].

