
Figure 8.
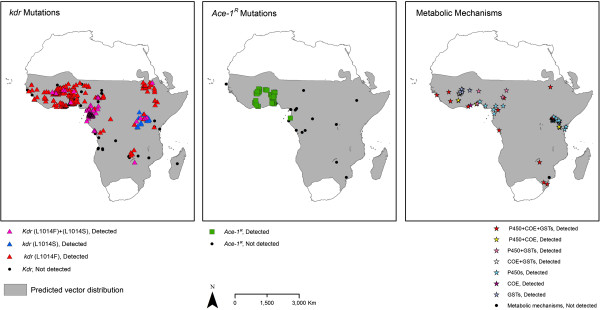
Distribution of molecular / biochemical resistance mechanisms in An. gambiae s.l. collected between 2001 and 2012. For sites for which multiple collections were tested, ‘detected’ is shown in preference to ‘not detected’. Shading indicates the predicted distribution of the species complex [42].