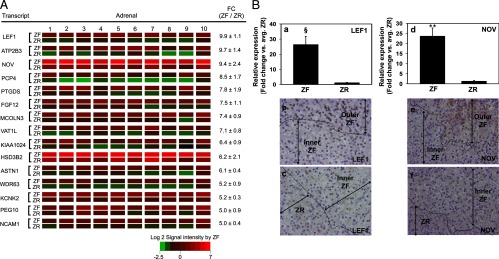
Figure 3.

A, Heat map representation of microarray analysis for the 15 transcripts with the highest differential expression in ZF vs ZR (n = 10). Normalized log2 signal intensity acquired from microarray analysis is represented by color (see color bar). Fold change was calculated as the average of normalized ZF signal intensities divided by that of normalized ZR signal intensities. Data are represented as mean ± SEM. FC, fold change. All transcripts showed a significance of P < .05. B, Quantitative RT-PCR and immunohistochemical analysis for ZF-expressed LEF1 and NOV. Validation of microarray analysis was done by real-time qPCR (a and d) and immunohistochemistry (b, c, e, and f) for transcripts with high differential expression in ZF vs ZR, namely LEF1 and NOV. Both LEF1 and NOV showed a higher expression in the outer ZF as compared with the inner ZF and ZR. Ten ZF-ZR pairs were used for the qPCR analysis. §, P < .005, **, P < .001, by paired t test.
