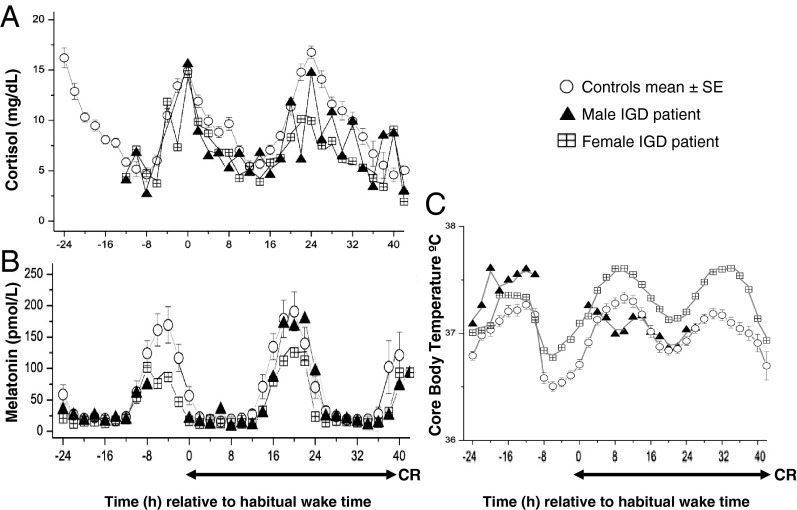
Figure 1.
Melatonin (A) and cortisol (B) levels and CBT (C) referenced to each participant's habitual wake time. The duration of the CR is also shown. Data for individual IGD participants are shown as triangles (male IGD participant) and checkered squares (female IGD participant), and each data point represents averaged 2-hour bins. CBT data for the male IGD participant (C, triangles) is incomplete due to failure of the temperature probe. In the healthy controls, data of each participant were averaged across 2-hour bins and then averaged across all control participants. The mean ± SEM of averaged 2-hour bins for the entire control group is shown in circles.

