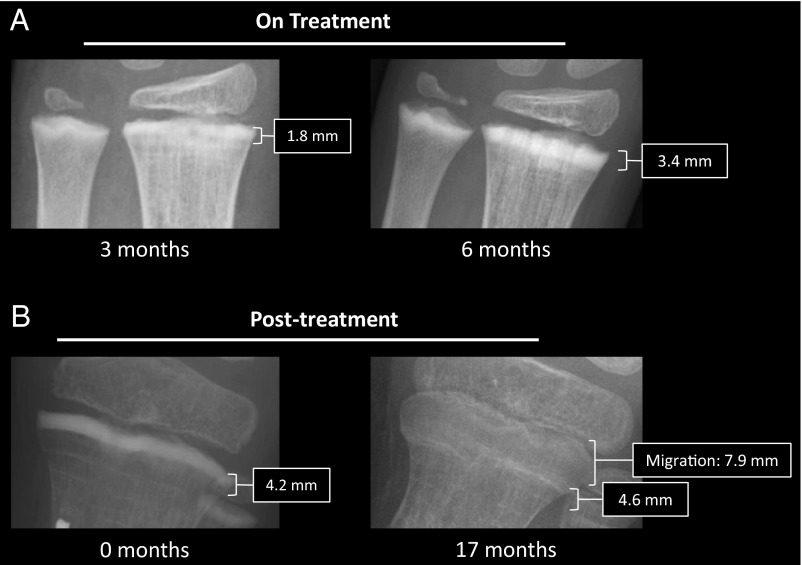
Figure 1.
Radiographs. A, Radiographic images of the patient's left distal radius and ulna during monthly denosumab treatment. The image on the left was taken after three doses of denosumab, and the image on the right was taken after 6 months of treatment. Thick, sclerotic bands developed adjacent to the growth plate, which increased in width from approximately 1.8–3.4 mm over the course of treatment, indicating ongoing bone formation at the growth plate. B, Posttreatment radiograph of the proximal tibia taken shortly after denosumab discontinuation demonstrates an approximate 4.2-mm sclerotic band (left panel). Seventeen months later the band, now approximately 4.6 mm, has migrated approximately 7.9 mm from the epiphysis and become more radiolucent (right panel), again demonstrating growth over this time period.

