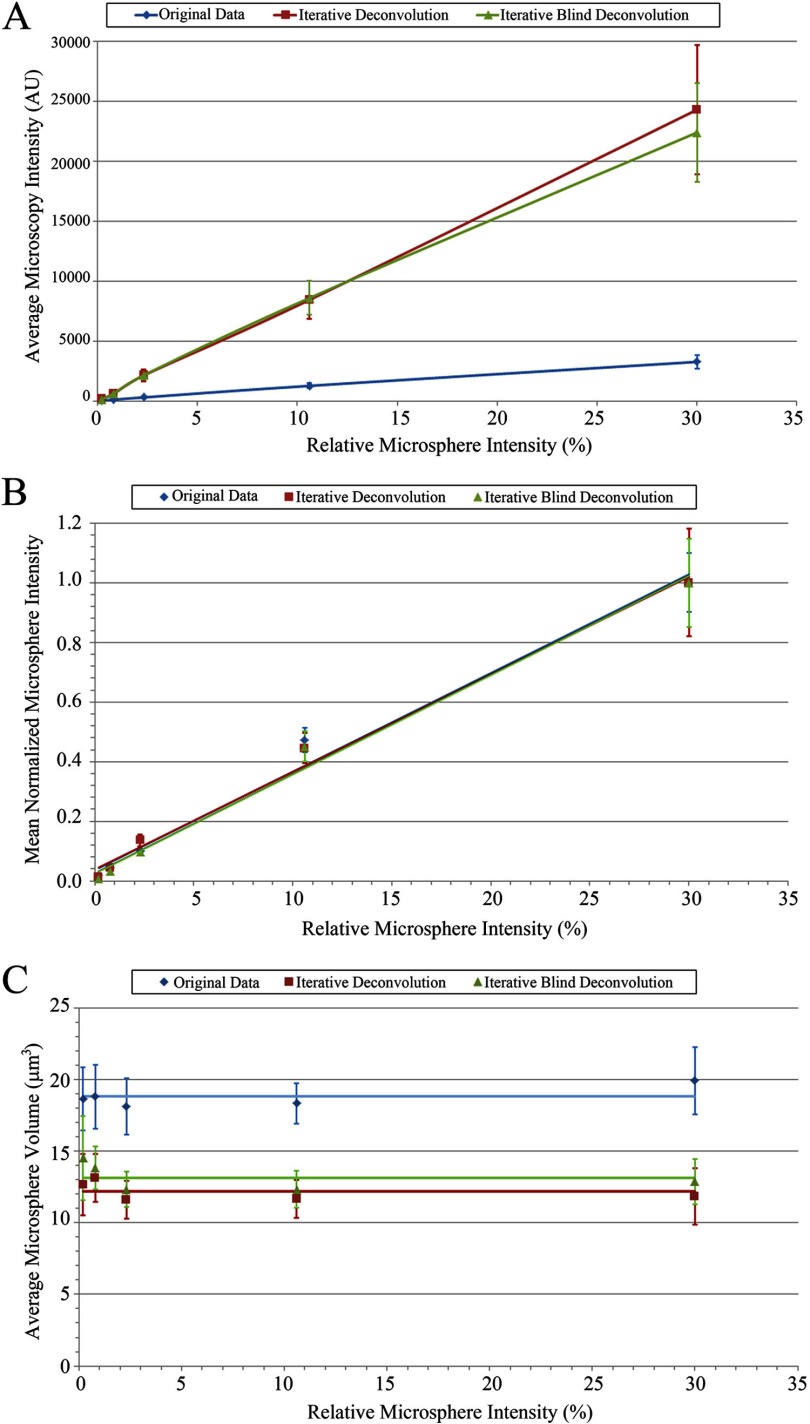
Figure 3.
Wide-field calibration, increased intensity, and preservation of the quantitative mean intensity relationship upon deconvolution and reduction in microsphere volume. Graphs of the average microsphere intensity (A), average normalized microsphere intensity (B), and average microsphere volume (C), as determined using Imaris 3D image analysis software for the original wide-field data (blue diamonds), iterative deconvolution data (red squares), and iterative blind deconvolution data (green triangles), plotted against the relative microsphere intensities given by the microsphere manufacturer. (A and B) Lines are linear regression best fits. (C) Horizontal lines correspond to the average volume of all of the microspheres from all three slide sets for each condition. Error bars are sd of the mean values for three experiments.

