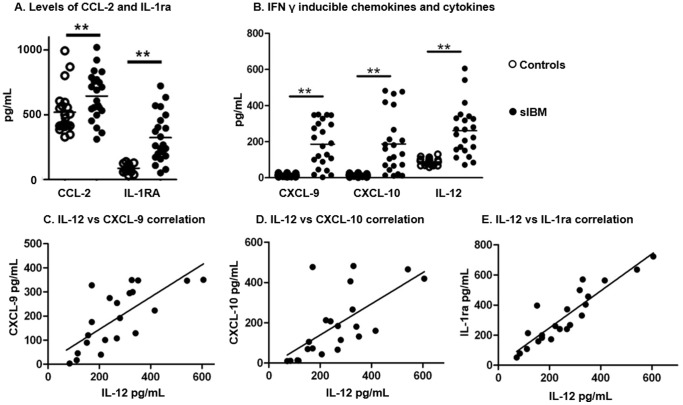
Figure 1. Cytokine and chemokine levels in sIBM patients compare to healthy controls.
A. Pooled data showing serum levels (pg/mL) of CCL-2 and IL-1ra in sIBM patients and controls; p<0.0001 and p = 0.025 respectively. B. Pooled data showing serum levels (pg/mL) of CXCL-9, CXCL-10 and IL-12 in sIBM patients (open circles) and controls (full circles); p<0.0001 for all. C. Correlation (linear regression) between serum level of IL-12 and serum levels of CXCL-9 (C), CXCL-10 (D) and IL-1ra (E). Horizontal lines indicate means; *p<0.05; **p<0.001.

