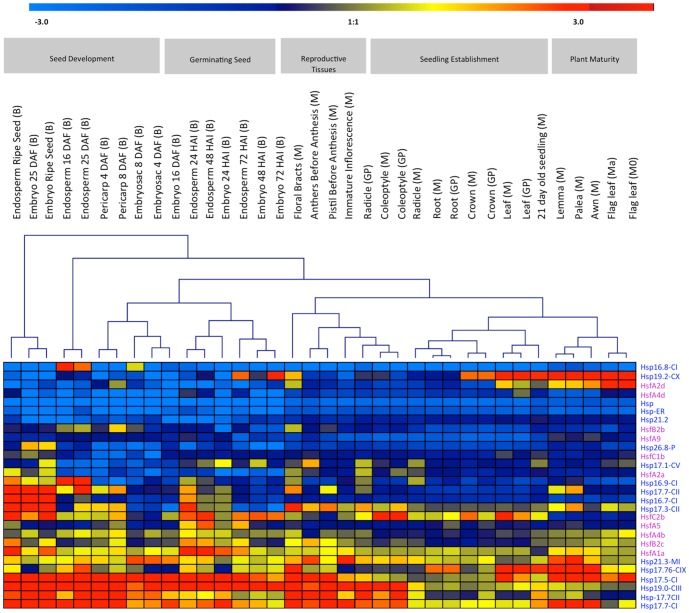
Figure 2. Expression profiles of sHsp and Hsf family genes during various stages of plant ontogeny analyzed by the Affymetrix 22K barley gene chip.
Horizontal rows represent expression patterns of individual gene. Trivial names of genes as well as the corresponding Affymetrix IDs are given. Vertical lines represent the developmental stages and investigated tissues. Signal intensities: red, high expression; yellow, moderate expression; blue, low expression. Represented cultivars are named as M, ‘Morex’; Mo, ‘Morocco’, Ma ‘Martin’, B, ‘Barke’; GP, ‘Golden Promise’. Quantile normalized expression values are given as log2.

