
Figure 1.
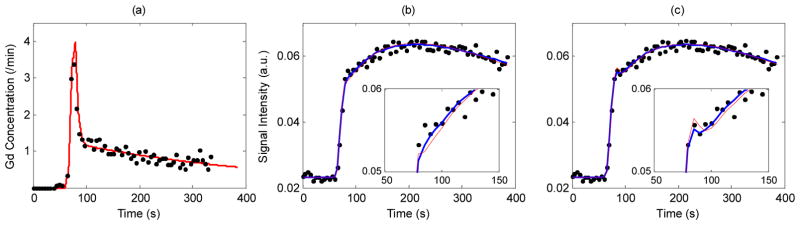
(a) Measured AIF from prostate DCE-MRI data (black dots) and the box-exponential clearance function fit (red solid line) used for simulation. (b) Representative MRI data generated using the MMID4 and the 3S2X model (Ktrans=0.25/min with PS=0.28/min and Fp=1.2/min, vb=0.06, ve=0.45, τb=0.05s, τi=0.2s and Tc=3s) with noise level SNR=20 (black dots) and the model fits using SSM2 (blue thick line) and GKM2 (red thin line). (c) Similar to (b) with ATHX (blue thick line) and ATH (red thin line).