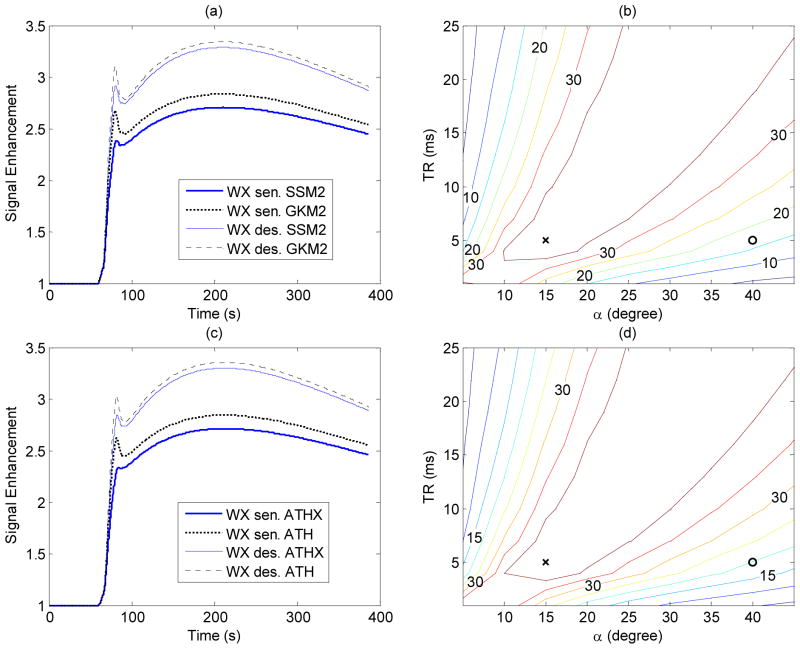
Figure 2.
The effect of water exchange on DCE-MRI time intensity curve depending on the scan condition. (a) Representative MRI signal curves generated using GKM2 and SSM2 models (Ktrans=0.25/min with PS=0.28/min and Fp=1.2/min, vb=0.06, ve=0.45, τb=0.05s, τi=0.2s and Tc=3s) in two scan conditions; water-exchange (WX) sensitized (TR=5ms, flip angle=15°) and water-exchange desensitized (TR=5ms, flip angle=40°). (b) Contour plot of sum of absolute difference between GKM2 and SSM2 curves (SDC) for different flip angle α and TR values. The cross (x) and circle (o) marks correspond to water-exchange-sensitized acquisition (TR=5ms, flip angle=15°) and water-exchange-desensitized acquisition (TR=5ms, flip angle=40°) respectively. (c) and (d) are same as (a) and (b) but with the ATHX and ATH models.

