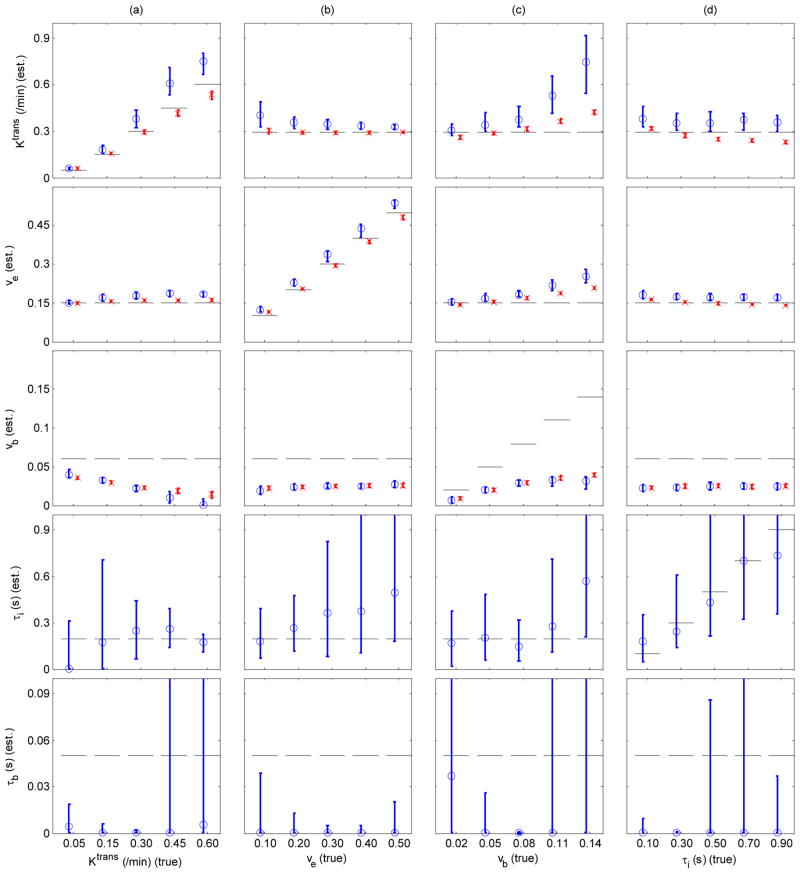
Figure 3.
Accuracy and precision of SSM2 (circles and solid blue lines) and GKM2 (crosses and dashed red lines) parameter estimation. Each column represents a case where all model parameters were held constant except one parameter; Ktrans (a), ve (b), vb (c) and τi (d). In each column, the parameter varied during generation of reference data is shown on the x-axis. Plotted are the median and inter-quartile ranges of estimated parameters from 100 noisy data sets for each case. Horizontal dashed lines represent the true values used for the reference data.

