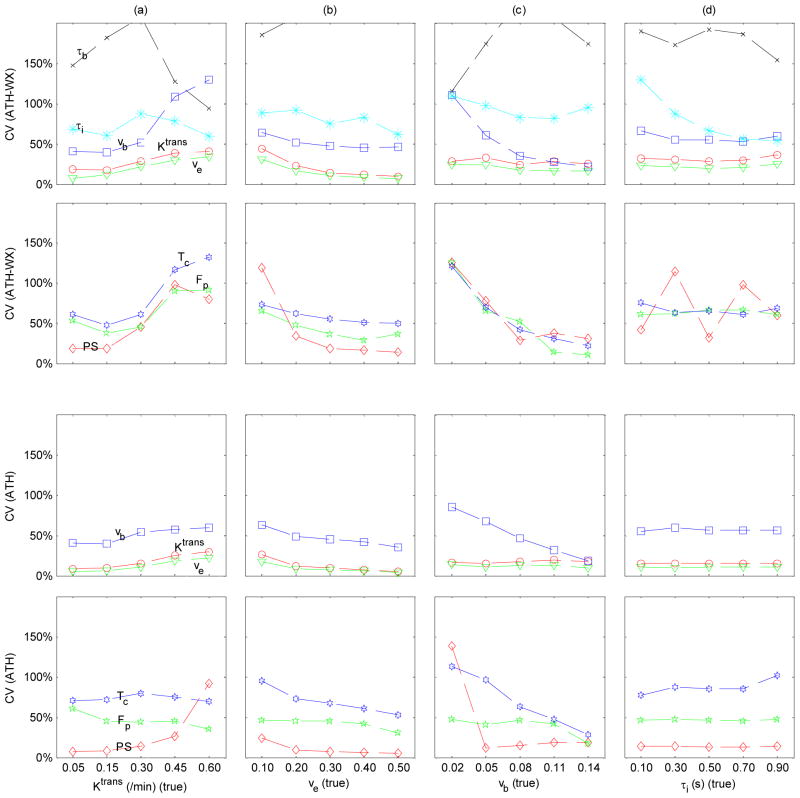
Figure 5.
Coefficient of variation (CV) of estimated ATHX (top 2 rows) and ATH (bottom 2 rows) model parameters (red circles for Ktrans, green triangles for ve, blue squares for vb, black crosses for τb, cyan asterisks for τι, red diamonds for PS, green pentagrams for Fp and blue hexagram for Tc) depending on the change in one parameter as noted in the x-axis. Each column represents a case of changing only one parameter; Ktrans (a), ve (b), vb (c) and τi (d).

