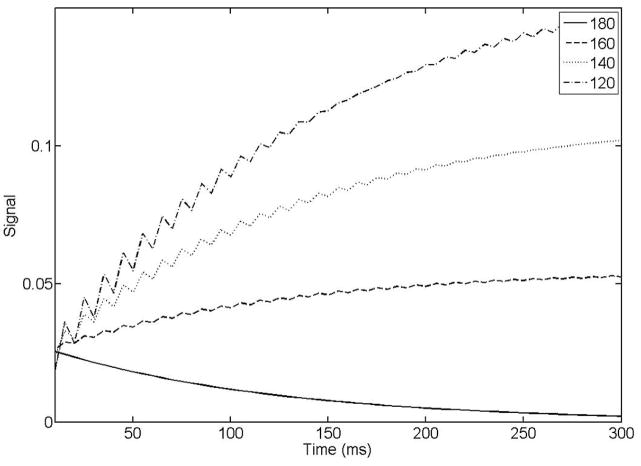
Figure 4.
Fat signal as a function of echo time in the rTSE sequence. As B1 inhomogeneity increases, fat signal rises from an initially suppressed state towards its steady-state value, determined from the particular flip angle it experiences and its specific off-resonance. Numbers in figure legend indicate the refocusing flip angle simulated (i.e. degree of B1 inhomogeneity).

