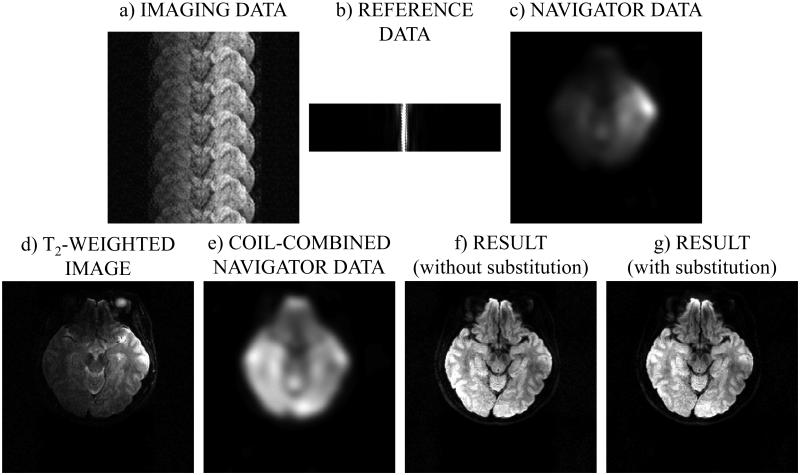
Fig. 7.
The images shown here aim to illustrate key steps of the algorithm from Fig. 6. a-c) The input to the algorithm from Fig. 6 consists of imaging data, navigator data and at least one TR worth of non-phase-encoded reference data to correct for EPI ghosting artifacts. d) The fully-sampled b ≈ 0 data were reconstructed using the method from (1), one coil-element at a time (coil element 2/8 here). e) All coil elements were combined for the navigator data, and the resulting images were used for motion-correction, regularization, solver initialization and optionally for direct data replacement (see Fig. 6). f,g) The reconstructed result is displayed with and without the optional data replacement, which had little effect in this particular case. The dataset was acquired using R = 6, 192×192 matrix size, Nb = 4, Nd = 6, and the 9 displayed slice corresponds to b = 471 s/mm2.

