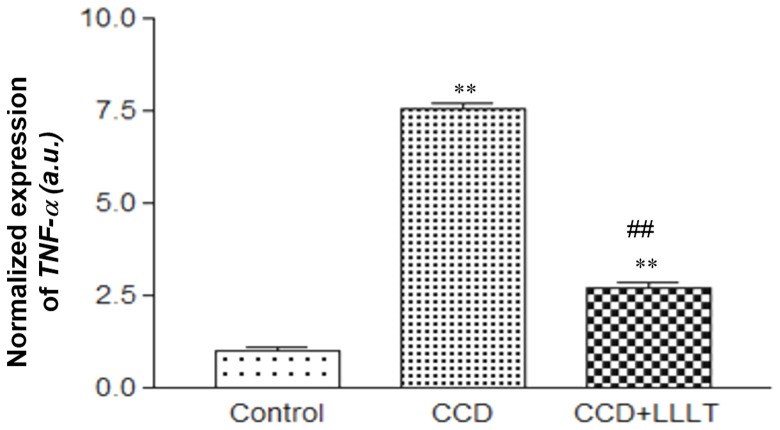
Figure 3. LLLT suppressed the mRNA expression level of CCD-induced TNF-α.
The level of TNF-α mRNA expression was analyzed using the 2−ΔCT method and normalized to the Control group. The levels of statistical significance are as follows: **, p<0.01 relative to the Control group; ##, p<0.01 relative to the CCD group.

