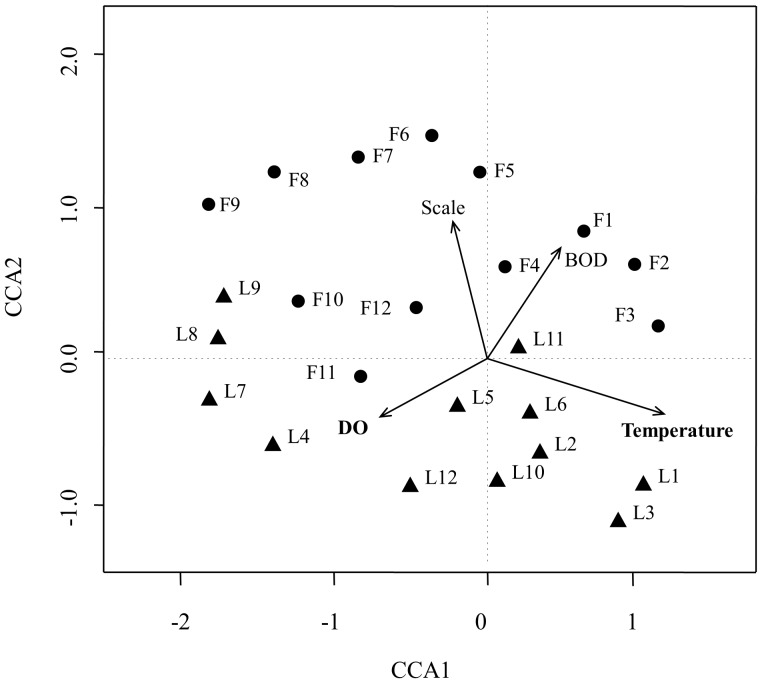
Figure 3. Canonical correspondence analysis (CCA) of pyrosequencing data and measurable variables in a full- and lab-scale bioreactors.
Arrows indicate the direction and magnitude of measurable variables associated with bacterial community structures. Circles and triangles represent different bacterial community structures from the full- and lab-scale bioreactor, respectively. Samples are named with “F” (Full-scale bioreactor) or “L” (Lab-scale bioreactor) and numbers. Sample numbers: 1- May 2010, 2- June 2010, 3-July 2010, 4- August 2010, 5-September 2010, 6- October 2010, 7-November 2010, 8-December 2010, 9-January 2011, 10- February 2011, 11-March 2011, 12-April 2011.

